


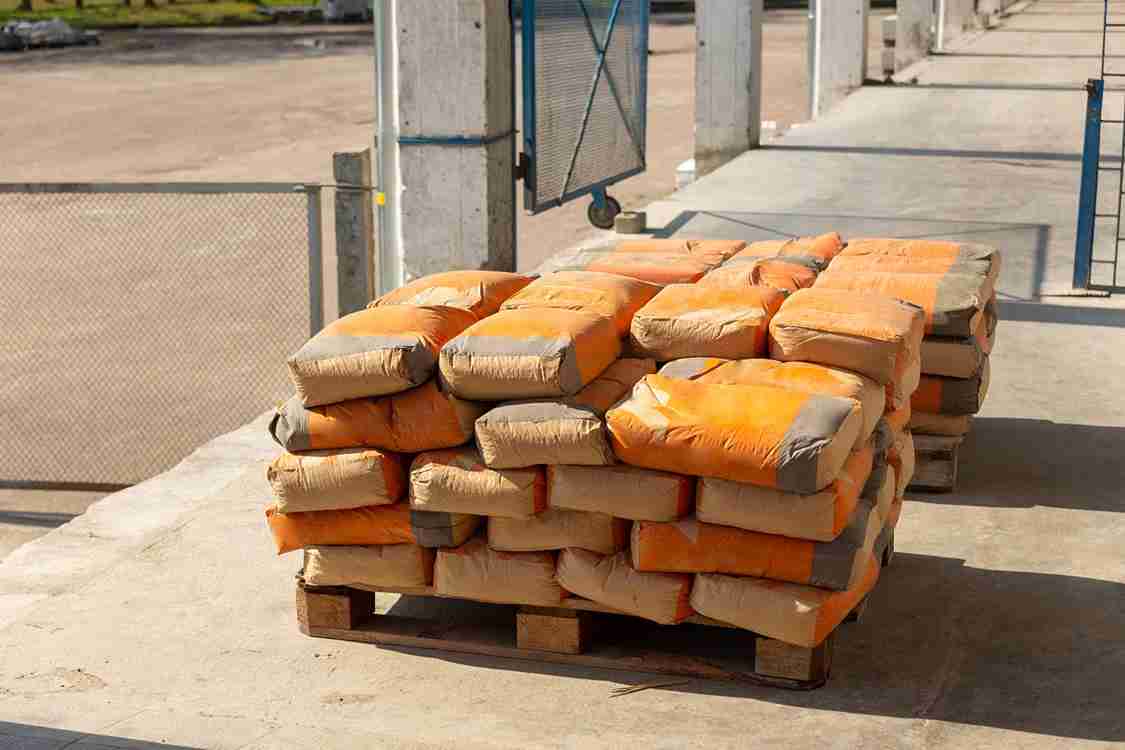

Nigeria’s cement industry has entered the final quarter of 2026 with a pronounced tension between producer profitability and construction affordability. Dangote Cement, BUA Cement and HBM Nigeria reported combined nine-month revenue of approximately ₦5.79 trillion to September 30, up 20.8% year on year. Their combined profit after tax reached approximately ₦1.71 trillion, an increase of 38%. At the same time, retail prices remain elevated. November market trackers indicate prices around ₦12,000–₦13,000 in several major urban markets, with some brand and dealer quotations higher. The Federal Competition and Consumer Protection Commission (FCCPC) has also identified possible price manipulation as an issue requiring investigation, while acknowledging that energy, exchange-rate exposure and logistics are among the cost factors manufacturers have cited.
Energy expenditure provides a measurable part of the explanation. Dangote Cement and BUA Cement reported a combined ₦797.1 billion in energy costs for the first nine months of 2026, although the Dangote figure includes operations outside Nigeria. The figures demonstrate the scale of the operating burden but do not establish a uniform industry-wide energy-cost ratio. For construction businesses, the consequences extend beyond the price of a bag. Cement costs influence project budgets, working-capital requirements and financing needs. The central question is whether lower unit production costs, stronger competition and more efficient distribution can improve affordability while preserving investment in domestic manufacturing.
Download registry: The model will capture the company financials, energy expenditure, cement prices, installed capacity, market concentration, financing conditions and the operational KPIs identified in the article. Missing production-volume and construction CapEx data will remain explicit data gaps rather than being estimated.
The Cement Price Ledger: Affordability Under Pressure
The original assumption that cement was selling for ₦7,500–₦8,200 per 50kg bag is no longer defensible for a November 2026 publication. The FCCPC’s August 18 preliminary findings documented a significant price increase during the first half of the year. Its market intelligence showed that a 50kg bag which sold for approximately ₦9,300–₦9,700 in January was selling for ₦10,500–₦13,000 by mid-year. By July, some locations recorded prices between ₦13,000 and ₦15,000. More recent market trackers show continued regional and brand differences. A November 7 estimate placed the average Abuja price at approximately ₦12,000, with a range of ₦11,000–₦13,500. The same tracker estimated Lagos at ₦12,720 and Port Harcourt at ₦12,960. A separate Lagos tracker recorded Dangote cement at ₦13,700 and HBM Elephant at ₦13,500–₦13,800 on November 7.
These are indicative market observations, not official nationwide price quotations. Dealer margins, cement grade, order volume, delivery arrangements and location can produce different final prices. The figures should therefore be used as market references rather than a single national retail average. The price question becomes more significant when considered alongside the industry’s installed capacity. The FCCPC estimates that Nigeria has more than 60–65 million metric tonnes of annual installed capacity, against estimated domestic consumption of 25–30 million tonnes. It also describes Nigeria as a net cement exporter to neighbouring markets.
That capacity-consumption gap does not, by itself, establish actual plant utilization. Exports, plant downtime, maintenance, production constraints and differences between installed and operational capacity must be accounted for. It does, however, raise a legitimate competition and cost-efficiency question: why has substantial domestic production capacity not translated into stronger downward pressure on retail prices?
Energy Economics: The ₦797.1 Billion Cost Signal
Cement manufacturing is energy-intensive. Kiln operations require sustained high temperatures to produce clinker, while crushing, grinding, material handling and packaging require substantial electricity. Producers also operate captive power facilities to protect production from unreliable grid supply. The nine-month 2026 disclosures show the financial scale of this exposure. Dangote Cement reported group fuel and power expenditure of ₦580.5 billion for the nine months ended September 30, compared with ₦569.0 billion in the corresponding period of 2025. BUA Cement reported energy costs of ₦216.6 billion, up from ₦178.2 billion.
Together, the two companies reported ₦797.1 billion in energy expenditure, 6.7% above the ₦747.2 billion recorded in the comparable 2025 period. The geographical scope requires care. Dangote Cement’s ₦580.5 billion figure is a group figure covering its African operations, not Nigeria alone. Its Nigerian parent-company fuel and power expenditure was separately reported at ₦313.9 billion. BUA’s reported energy figure should also be interpreted within the company’s own reporting perimeter. The combined ₦797.1 billion is therefore not a Nigeria-only industry energy bill.
The figures also show different operating trajectories. Dangote’s group fuel and power expenditure increased by 2.0%, while BUA’s energy costs rose by 21.5%. These movements may reflect differences in production volumes, energy mix, operating conditions and cost classification. They do not establish that one producer is inherently more energy-efficient than the other.
HBM Nigeria reported production variable costs of ₦226.3 billion, up 4.2%. That line combines fuel, power, raw materials and consumables, so it cannot be treated as an energy-only measure or directly added to the two companies’ energy expenditure. The more useful corporate metric is energy cost per tonne of cement produced. It allows boards and investors to distinguish a higher energy bill caused by increased output from a deterioration in unit-cost efficiency.
Producer Earnings and the Competition Question
The financial results sharpen the tension between the performance of cement manufacturers and the affordability concerns facing builders. Dangote Cement, BUA Cement and HBM Nigeria reported combined nine-month revenue of approximately ₦5.79 trillion, up 20.8% from the corresponding period of 2025. Their combined profit after tax was reported at approximately ₦1.71 trillion, an increase of 38%.
The reported company figures were:
- Dangote Cement: Revenue of approximately ₦3.774 trillion and profit after tax of ₦974.8 billion.
- BUA Cement: Revenue of approximately ₦1.087 trillion and profit after tax of ₦463.1 billion.
- HBM Nigeria: Revenue of approximately ₦928 billion and profit after tax of ₦272 billion.
These are reported company results, not a measure of Nigeria-only cement sales across the three groups. Dangote’s consolidated revenue includes its Pan-African operations. The combined figure should not be presented as domestic market revenue. Higher revenue and profit do not independently establish excessive pricing or anti-competitive conduct. Sales volumes, realized selling prices, product mix, foreign operations, exchange-rate effects, operating costs and tax charges all influence reported earnings.
Nevertheless, the financial performance makes transparency more important. The FCCPC’s August investigation reported that three major undertakings accounted for more than 90% of installed production capacity, based on publicly available estimates. It said its preliminary findings suggested possible price manipulation and that it was testing manufacturers’ explanations against verified information on costs, production, pricing and market conditions.
The Commission had identified energy, naira depreciation and the cost of imported machinery and spare parts, transport and logistics as factors cited by industry participants. It was also investigating whether market conduct, restrictions on domestic supply or distribution practices had weakened competition. This is a preliminary regulatory position, not a final determination that manufacturers colluded or manipulated prices. The decisive evidence will be the Commission’s reconciliation of production costs, ex-factory prices, distribution margins, domestic supply, exports and regional retail prices.
Construction CapEx: The Cost of Materials and Credit
Cement is a core input in housing, commercial property, roads and civil engineering. When its price rises, developers must commit more capital to complete the same physical scope of work. Contractors may also face higher working-capital requirements where material purchases precede certified payments or project revenue. The financing environment compounds the problem. At its September 21–22, 2026 meeting, the Central Bank of Nigeria reset the Monetary Policy Rate to 23% and retained the Cash Reserve Requirement at 45% for deposit money banks.
The MPR is a policy benchmark, not the borrowing rate available to a property developer or construction contractor. Actual lending costs depend on credit risk, collateral, tenor, lender funding costs and the expected cash flow of the project.
For a developer, higher material costs can increase the amount of equity and credit required before a project generates income. Where financing is expensive, the response may include phased construction, delayed project commencement, changes in specifications or the postponement of new investment. These are credible transmission channels, but the available figures in this report do not quantify a nationwide decline in private construction CapEx. Such a conclusion would require corroborating data on building approvals, construction output, private capital expenditure, mortgage credit, project commencements and cement sales by customer category.
The wider business environment offers a useful but limited reference. The Stanbic IBTC Nigeria Purchasing Managers’ Index eased to 55.7 in October from 56.4 in September, while remaining above the 50-point threshold associated with expansion. This indicates that private-sector business conditions continued to improve, although at a slower pace. It is not a direct measure of construction activity or cement demand.
The C-Suite Industrial Scorecard
Corporate boards, lenders and infrastructure investors should assess the sector through operating performance rather than revenue growth alone.
Energy cost per tonne: Measure fuel and electricity expenditure against clinker and cement output. Separate kiln fuel, captive power and grid electricity to identify the source of cost changes.
Realized selling price and dispatch volume: Track average realized prices alongside tonnes sold. This distinguishes revenue growth driven by price changes from genuine expansion in physical demand.
Distribution cost per tonne: Monitor fuel consumption, freight rates, truck utilization, delivery turnaround and depot margins. This provides a measurable basis for explaining regional price differences.
Practical capacity utilization: Compare actual production with operationally available capacity, excluding capacity unavailable because of maintenance or other constraints. Nameplate capacity alone is insufficient.
Domestic and export sales mix: Separate local dispatches from export volumes to establish how much production is available to the domestic market and how regional sales affect plant economics.
Strategic Bold Lite Outlook: The Route to Lower-Cost Cement
Nigeria’s cement affordability challenge cannot be resolved through price directives alone. The cost structure, market organization and distribution system require separate interventions. Manufacturers can strengthen competitiveness through efficient kiln operations, dependable gas supply, alternative fuels, energy recovery and improved fleet management. Biomass and waste-derived fuels may reduce dependence on conventional kiln fuels where supply quality, processing costs and environmental requirements make substitution commercially viable. CNG-powered haulage can reduce diesel exposure on suitable routes, but its benefits depend on vehicle-conversion costs, refuelling infrastructure and gas availability.
Government policy should focus on reliable industrial energy, efficient freight corridors, transparent market information and effective competition oversight. The FCCPC investigation is an opportunity to establish whether prevailing prices are adequately explained by legitimate costs or whether anti-competitive conduct has contributed to the market outcome. The industry’s next performance test is not simply whether revenue continues to rise. It is whether manufacturers can increase output and reduce unit costs, whether competition improves price discovery, and whether construction businesses regain greater certainty in budgeting and project delivery.
Nigeria’s cement margin equation is shaped by energy expenditure, production efficiency, market concentration and distribution costs. The sector’s financial strength will have wider economic value only when those advantages translate into competitive prices and more affordable construction.
References
1. Federal Competition and Consumer Protection Commission (FCCPC) — August 18, 2026 preliminary findings from the cement-market investigation. See the Commission’s release, Cement: FCCPC Establishes Possible Price Manipulation. Direct report.
2. Dangote Cement Plc — Nine-month 2026 interim results, covering group revenue, profit after tax, sales volumes, fuel and power expenditure, and operating performance. Filed October 28, 2026.
3. BUA Cement Plc — Nine-month 2026 unaudited financial results, released October 29, 2026, covering revenue, profit after tax, cost of sales and energy expenditure.
4. HBM Nigeria Plc — Nine-month 2026 unaudited financial results, released October 29, 2026, covering net sales, operating profit, profit after tax and production performance.
5. Central Bank of Nigeria (CBN) — Monetary Policy Committee decisions of September 21–22, 2026, including the 23% Monetary Policy Rate and 45% Cash Reserve Requirement for deposit money banks.
6. Stanbic IBTC / S&P Global Nigeria PMI — October 2026 Purchasing Managers’ Index, which eased to 55.7 from 56.4 in September while remaining in expansion territory.
7. Buildocrat Nigeria Construction Rate Book — Indicative cement prices by brand and location, updated November 7, 2026. Includes Abuja, Lagos and Port Harcourt estimates.
8. Landalyst — Lagos Cement Prices by Brand — Brand-level 50kg cement price observations in Lagos, including Dangote and HBM Elephant, recorded November 7, 2026.